

Coopers Stadium · Adelaide
Match Events










Match Statistics
72%Ball Possession28%
6Shots on Goal6
12Shots off Goal2
11Corner Kicks2
84%Pass Accuracy55%
4Goalkeeper Saves4
14Fouls10
Lineups & Player Ratings
4-3-3
4-2-3-1
 20
 23
 29
 37
 8
 7
 17
 21

 19


Substitutes










Last 20 Matches — Statistics
 Adelaide United (20/20)
8W
5D
7L
Win rate40.0%
Goals for24
Goals against23
Avg. scored1.20
Avg. conceded1.15
 Brisbane Roar FC (20/20)
6W
5D
9L
Win rate30.0%
Goals for31
Goals against31
Avg. scored1.55
Avg. conceded1.55
Adelaide United's match results (20 matches)








Brisbane Roar FC's match results (20 matches)
Last 20 Matches — Home / Away
Adelaide United At home (20/20)
6W
5D
9L
Win rate30.0%
Goals for22
Goals against32
Avg. scored1.10
Avg. conceded1.60
Brisbane Roar FC Away (20/20)
5W
7D
8L
Win rate25.0%
Goals for25
Goals against33
Avg. scored1.25
Avg. conceded1.65
Adelaide United's home matches (20 matches)
Brisbane Roar FC's away matches (20 matches)
H2H
Adelaide United (21 matches)
8W
3D
10L
Win rate38.1%
Goals for27
Goals against35
Avg. scored1.29
Avg. conceded1.67
Brisbane Roar FC (21 matches)
10W
3D
8L
Win rate47.6%
Goals for35
Goals against27
Avg. scored1.67
Avg. conceded1.29
Head-to-head match results (21 matches)
H2H — Home / Away
Adelaide United At home (11 matches)
3W
2D
6L
Win rate27.3%
Goals for13
Goals against14
Avg. scored1.18
Avg. conceded1.27
Brisbane Roar FC Away (11 matches)
6W
2D
3L
Win rate54.5%
Goals for14
Goals against13
Avg. scored1.27
Avg. conceded1.18
Head-to-head results with the same home/away assignment (11 matches)
Standings
Adelaide United4th · 28 ptsBrisbane Roar FC7th · 22 ptsPlayer Rankings (Goals)
View player rankings →


Match Information
CompetitionA-League
Season2017
RoundRegular Season - 13
Date & Time2017/12/30 15:35 JST
VenueCoopers Stadium
CityAdelaide
RefereeAdam Fielding, Australia
Match ID30404
Match Venue
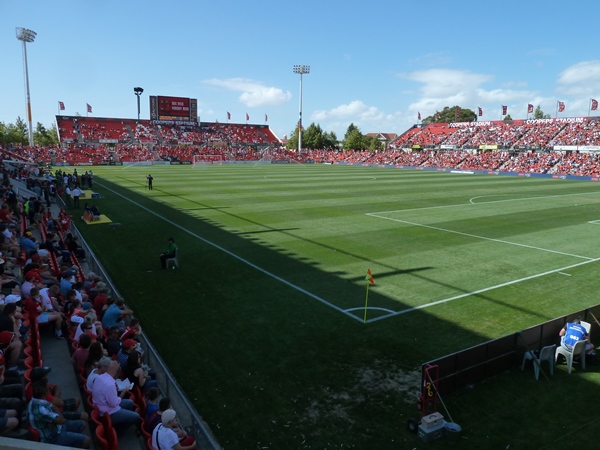
Match VenueCoopers Stadium
Venue classificationAdelaide United home stadium
Capacity17,000
AddressHolden Street, Hindmarsh
Surfacegrass