

Seymour Shaw Park · Sydney
Last 20 Matches — Statistics
 Sutherland Sharks (20/20)
5W
5D
10L
Win rate25.0%
Goals for23
Goals against34
Avg. scored1.15
Avg. conceded1.70
 Sydney FC U23 (20/20)
5W
2D
13L
Win rate25.0%
Goals for25
Goals against52
Avg. scored1.25
Avg. conceded2.60
Sutherland Sharks's match results (20 matches)














Sydney FC U23's match results (20 matches)
Last 20 Matches — Home / Away
Sutherland Sharks At home (20/20)
5W
6D
9L
Win rate25.0%
Goals for11
Goals against24
Avg. scored0.55
Avg. conceded1.20
Sydney FC U23 Away (20/20)
5W
3D
12L
Win rate25.0%
Goals for25
Goals against48
Avg. scored1.25
Avg. conceded2.40
Sutherland Sharks's home matches (20 matches)



Sydney FC U23's away matches (20 matches)
H2H
Sutherland Sharks (8 matches)
1W
5D
2L
Win rate12.5%
Goals for15
Goals against13
Avg. scored1.88
Avg. conceded1.63
Sydney FC U23 (8 matches)
2W
5D
1L
Win rate25.0%
Goals for13
Goals against15
Avg. scored1.63
Avg. conceded1.88
Head-to-head match results (8 matches)
H2H — Home / Away
Sutherland Sharks At home (3 matches)
0W
2D
1L
Win rate0.0%
Goals for4
Goals against5
Avg. scored1.33
Avg. conceded1.67
Sydney FC U23 Away (3 matches)
1W
2D
0L
Win rate33.3%
Goals for5
Goals against4
Avg. scored1.67
Avg. conceded1.33
Head-to-head results with the same home/away assignment (3 matches)
Standings
Sutherland Sharks13th · 29 ptsSydney FC U2314th · 29 ptsMatch Information
CompetitionNew South Wales NPL
Season2024
RoundRegular Season - 25
Date & Time2024/07/20 15:30 JST
VenueSeymour Shaw Park
CitySydney
Match ID1149213
Match Venue
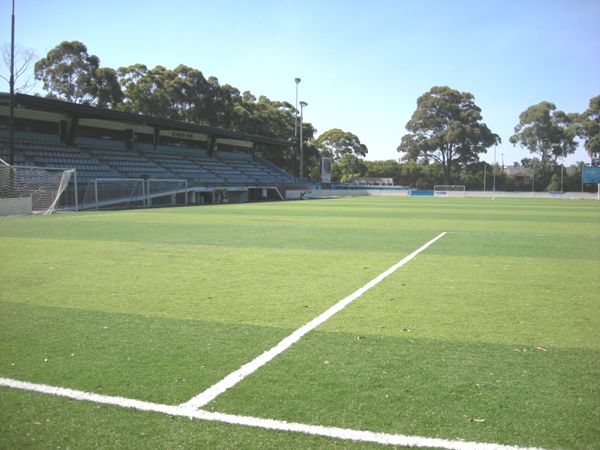
Match VenueSeymour Shaw Park
Venue classificationSutherland Sharks home stadium
Capacity5,000
AddressParkside Road, Miranda
Surfaceartificial turf