

HBF Park · Perth
Match Events






















Match Statistics
47%Ball Possession53%
6Shots on Goal8
8Shots off Goal5
14Corner Kicks9
80%Pass Accuracy84%
6Goalkeeper Saves5
11Fouls8
Lineups & Player Ratings
4-4-2
4-3-1-2











Substitutes





Last 20 Matches — Statistics
 Perth Glory (20/20)
5W
6D
9L
Win rate25.0%
Goals for37
Goals against41
Avg. scored1.85
Avg. conceded2.05
 Western Sydney Wanderers (20/20)
8W
3D
9L
Win rate40.0%
Goals for32
Goals against37
Avg. scored1.60
Avg. conceded1.85
Perth Glory's match results (20 matches)










Western Sydney Wanderers's match results (20 matches)
Last 20 Matches — Home / Away
Perth Glory At home (20/20)
8W
7D
5L
Win rate40.0%
Goals for43
Goals against38
Avg. scored2.15
Avg. conceded1.90
Western Sydney Wanderers Away (20/20)
5W
7D
8L
Win rate25.0%
Goals for28
Goals against35
Avg. scored1.40
Avg. conceded1.75
Perth Glory's home matches (20 matches)
Western Sydney Wanderers's away matches (20 matches)
H2H
Perth Glory (33 matches)
13W
8D
12L
Win rate39.4%
Goals for44
Goals against43
Avg. scored1.33
Avg. conceded1.30
Western Sydney Wanderers (33 matches)
12W
8D
13L
Win rate36.4%
Goals for43
Goals against44
Avg. scored1.30
Avg. conceded1.33
Head-to-head match results (33 matches)
H2H — Home / Away
Perth Glory At home (16 matches)
9W
5D
2L
Win rate56.3%
Goals for30
Goals against18
Avg. scored1.88
Avg. conceded1.13
Western Sydney Wanderers Away (16 matches)
2W
5D
9L
Win rate12.5%
Goals for18
Goals against30
Avg. scored1.13
Avg. conceded1.88
Head-to-head results with the same home/away assignment (16 matches)
Standings
Perth Glory12th · 22 ptsWestern Sydney Wanderers7th · 37 ptsPlayer Rankings (Goals)
View player rankings →

Match Information
CompetitionA-League
Season2023
RoundRegular Season - 21
Date & Time2024/03/16 17:45 JST
VenueHBF Park
CityPerth
RefereeS. Evans
Match ID1123658
Match Venue
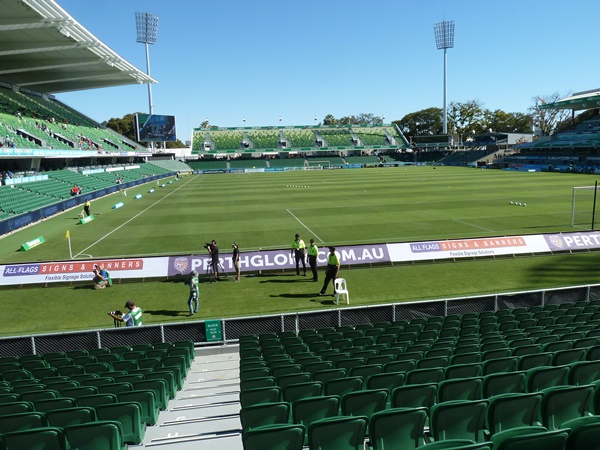
Match VenueHBF Park
Venue classificationPerth Glory home stadium
Capacity20,500
Address310 Pier Street, East Perth
Surfacegrass